

pyXenium.cci Tutorial#
Overview#
This notebook walks through the Atera WTA breast topology reproducibility bundle and focuses on how pyXenium.cci turns precomputed topology anchors plus cell-type expression support into interpretable sender-receiver hypotheses.
Biological question#
Which cell populations appear to drive the strongest cell-cell interaction communication programs across tumor, stromal, immune, and vascular compartments in the Atera breast sample?
from __future__ import annotations

import json
import os
import sys
from pathlib import Path

import pandas as pd
from IPython.display import Image, Markdown, display


def find_repo_root() -> Path:
    for candidate in (Path.cwd(), *Path.cwd().parents):
        if (candidate / "pyproject.toml").exists():
            return candidate
    raise RuntimeError("Could not locate the pyXenium repository root.")


REPO_ROOT = find_repo_root()
SRC_ROOT = REPO_ROOT / "src"
if str(SRC_ROOT) not in sys.path:
    sys.path.insert(0, str(SRC_ROOT))

pd.set_option("display.max_columns", 20)
pd.set_option("display.max_rows", 12)
ATERA_DATASET_PATH = Path(
    os.environ.get(
        "PYXENIUM_ATERA_DATASET",
        r"Y:\long\10X_datasets\Xenium\Atera\WTA_Preview_FFPE_Breast_Cancer_outs",
    )
)
TBC_RESULTS_PATH = ATERA_DATASET_PATH / r"sfplot_tbc_formal_wta\results"
ARTIFACT_DIR = REPO_ROOT / "manuscript" / "atera_wta_breast_topology"
RUN_FULL_ANALYSIS = False

ATERA_DATASET_PATH, TBC_RESULTS_PATH, ARTIFACT_DIR
(WindowsPath('Y:/long/10X_datasets/Xenium/Atera/WTA_Preview_FFPE_Breast_Cancer_outs'),
 WindowsPath('Y:/long/10X_datasets/Xenium/Atera/WTA_Preview_FFPE_Breast_Cancer_outs/sfplot_tbc_formal_wta/results'),
 WindowsPath('D:/GitHub/pyXenium/manuscript/atera_wta_breast_topology'))
Dataset#
Raw study: Atera WTA FFPE breast Xenium export with precomputed
t_and_candStructureMapanchors.Versioned outputs in this repository:
manuscript/atera_wta_breast_topology/.Canonical API:
cci_topology_analysisand the packagedrun_atera_wta_breast_topology(...)workflow.
Setup#
The notebook renders committed CSV and figure artifacts generated from a real run, and it keeps a rerun cell for the full workflow when local data are available.
payload = json.loads((ARTIFACT_DIR / "summary.json").read_text(encoding="utf-8"))
scores = pd.read_csv(ARTIFACT_DIR / "cci_sender_receiver_scores.csv")

top_pairs = (
    scores.sort_values("CCI_score", ascending=False)
    .groupby(["ligand", "receptor"], as_index=False)
    .first()
    [["ligand", "receptor", "sender_celltype", "receiver_celltype", "CCI_score", "local_contact"]]
    .head(10)
)

display(top_pairs)
display(pd.DataFrame(payload["cci_acceptance"]))
| ligand | receptor | sender_celltype | receiver_celltype | CCI_score | local_contact | |
|---|---|---|---|---|---|---|
| 0 | CSF1 | CSF1R | CAFs, DCIS Associated | Macrophages | 0.507387 | 0.044743 |
| 1 | CXCL12 | CXCR4 | CAFs, DCIS Associated | T Lymphocytes | 0.633882 | 0.168430 |
| 2 | DLL4 | NOTCH3 | Endothelial Cells | Pericytes | 0.662811 | 0.135465 |
| 3 | JAG1 | NOTCH1 | 11q13 Invasive Tumor Cells | Basal-like Structured DCIS Cells | 0.502909 | 0.073062 |
| 4 | TGFB1 | TGFBR2 | Endothelial Cells | Endothelial Cells | 0.529126 | 0.051665 |
| check | ligand | receptor | observed_top_sender | pass | observed_rank | observed_top_receiver | |
|---|---|---|---|---|---|---|---|
| 0 | CSF1-CSF1R top sender should not be Mast Cells | CSF1 | CSF1R | CAFs, DCIS Associated | True | NaN | NaN |
| 1 | CXCL12-CXCR4 should keep CAFs, DCIS Associated... | CXCL12 | CXCR4 | NaN | True | 1.0 | NaN |
| 2 | DLL4-NOTCH3 top hit should be Endothelial Cell... | DLL4 | NOTCH3 | Endothelial Cells | True | NaN | Pericytes |
Core workflow#
A standard rerun goes through the packaged validation entrypoint so that the same cell-cell interaction panel and topology anchors are used each time.
from pyXenium.validation import run_atera_wta_breast_topology

study = run_atera_wta_breast_topology(
    dataset_root=str(ATERA_DATASET_PATH),
    tbc_results=str(TBC_RESULTS_PATH),
    output_dir="./atera_cci_outputs",
    export_figures=True,
)
The committed notebook output below reuses the versioned manuscript bundle so the page stays lightweight on Read the Docs.
if RUN_FULL_ANALYSIS and ATERA_DATASET_PATH.exists():
    from pyXenium.validation import run_atera_wta_breast_topology

    study = run_atera_wta_breast_topology(
        dataset_root=str(ATERA_DATASET_PATH),
        tbc_results=str(TBC_RESULTS_PATH),
        output_dir=str(ARTIFACT_DIR),
        export_figures=True,
    )
    display(pd.DataFrame(study["payload"]["cci_pair_summaries"]))
else:
    display(Markdown("Set `RUN_FULL_ANALYSIS = True` to recompute the Atera cell-cell interaction bundle from the local Xenium export."))
Set RUN_FULL_ANALYSIS = True to recompute the Atera cell-cell interaction bundle from the local Xenium export.
Visual outputs#
The summary heatmap collapses pairwise communication scores across sender-receiver compartments, while the hotspot overlay shows where the strongest local interaction pattern sits in tissue space.
display(Image(filename=str(ARTIFACT_DIR / "figures" / "cci_summary_heatmap.png")))
display(Image(filename=str(ARTIFACT_DIR / "figures" / "cci_hotspot_overlay.png")))

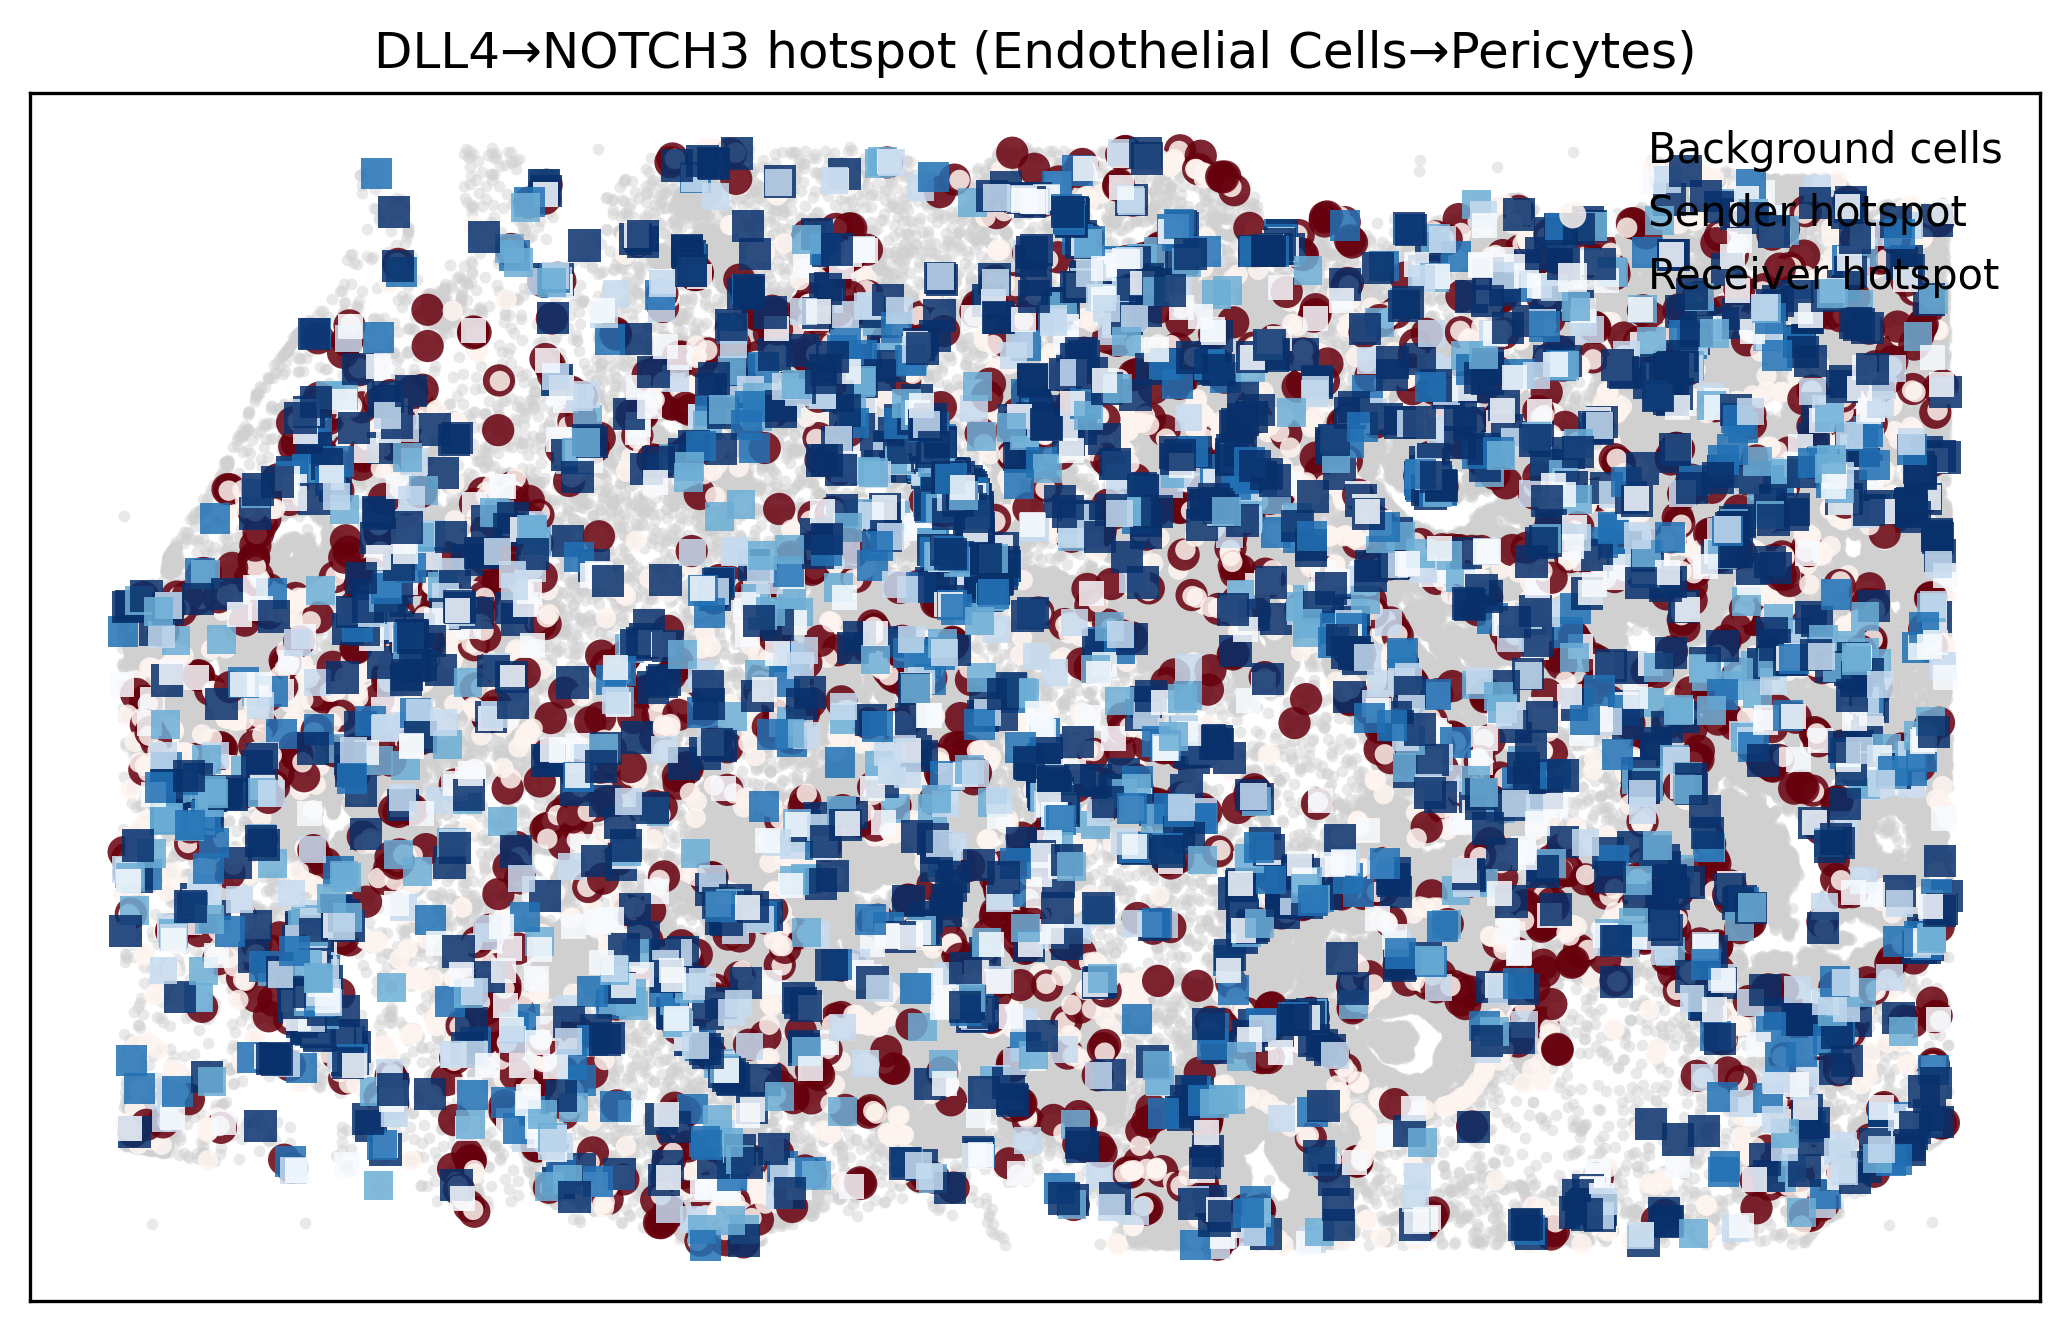
Biological interpretation#
The highest-ranking pairs in the committed Atera bundle reinforce a biologically mixed tissue architecture rather than a single tumor-autonomous program. Vascular signaling, stromal support, and immune-facing signals remain prominent because topology anchors reward both expression support and the spatial bridge between compartments. The hotspot map is especially useful when a strong pair would otherwise be dismissed as pseudobulk co-expression without local tissue evidence.
Caveats#
The score is a composite; a strong hit can be driven by anchor quality, expression support, and local contact in different proportions.
This notebook uses the fixed smoke-panel pairs from the Atera reproducibility workflow, not a whole-database cell-cell interaction scan.
Precomputed topology anchors should be interpreted as study-specific spatial priors, not universal cell-type distances.
Next steps#
Open the
pathwaynotebook to compare communication programs with pathway-level topology on the same Atera sample.Inspect
cci_component_diagnostics.csvwhen you need to understand why a pair ranked highly.Swap in a custom
interaction_pairstable if you want to test a focused biological hypothesis beyond the default smoke panel.