

GMI spatial gene modules#
This tutorial documents the WTA breast spatial module layer built on top of
pyXenium.gmi. The module workflow starts from a completed contour-GMI run and
does not rerun the vendored R Gmi fit.
pyxenium gmi modules \
  --gmi-output-dir pyxenium_gmi_outputs/full_contour_top500_spatial100 \
  --output-dir pyxenium_gmi_outputs/full_contour_top500_spatial100/modules
Biological question#
The primary question is whether the validated S1/S5 GMI effects form a coherent
spatial gene module. In the Atera WTA breast task, S1 is the invasive
tumor/CAF endpoint and S5 is the apocrine-luminal DCIS endpoint.
The module validation asks:
whether
NIBAN1andSORL1collapse into one S5/DCIS module;whether RNA-only and no-coordinate controls preserve that module;
whether spatial-only modules are driven by composition, rim/edge, CAF/ECM, vascular/pericyte, immune context, or coordinate features;
whether top1000 and all-nonempty sensitivity runs change the QC20 conclusion.
Method#
Each supervised GMI module is seeded by selected or bootstrap-stable GMI main effects. The seed is expanded with three evidence sources:
feature correlation across retained contours;
contour-neighborhood spatial-lag correlation;
GMI interaction edges from
interaction_effects.tsv.
The module score is written per contour, oriented toward the endpoint in
score_high_label, and summarized with curated pathway overlaps and Moran’s I /
Geary’s C spatial autocorrelation.
Outputs#
Each module run writes a modules/ directory containing:
spatial_modules.tsvmodule_features.tsvmodule_scores.tsv.gzmodule_enrichment.tsvmodule_interactions.tsvmodule_spatial_autocorr.tsveffect_graph_nodes.tsveffect_graph_edges.tsvsummary.jsonreport.mdoptional score maps under
figures/
PDC validation#
The final WTA breast module tutorial is generated from a fresh PDC Dardel 8-stage run under:
/cfs/klemming/scratch/h/hutaobo/pyxenium_gmi_modules_2026-04-30
The stages are:
Stage |
Purpose |
|---|---|
|
Fast smoke run and module artifact check |
|
Primary QC20 RNA + spatial model |
|
Spatial CV, bootstrap, and controls |
|
RNA-only module control |
|
Spatial-feature-only module control |
|
Coordinate-confounding control |
|
Expanded RNA feature budget |
|
Low-cell contour sensitivity |
Final PDC validation results#
The fresh PDC Dardel module validation completed all 8 stages on 2026-05-01 under:
/cfs/klemming/scratch/h/hutaobo/pyxenium_gmi_modules_2026-04-30
The submitted Slurm job chain was 20207833 through 20207840. The final
summary artifacts are:
/cfs/klemming/scratch/h/hutaobo/pyxenium_gmi_modules_2026-04-30/reports/pdc_gmi_module_validation_summary.json
/cfs/klemming/scratch/h/hutaobo/pyxenium_gmi_modules_2026-04-30/reports/pdc_gmi_module_validation_summary.md
Stage |
Contours |
Features |
Selected main effects |
Train AUC |
CV mean AUC |
Modules |
|---|---|---|---|---|---|---|
Smoke top200+spatial50 |
80 |
250 |
none |
0.50 |
- |
0 |
Full QC20 top500+spatial100 |
80 |
600 |
|
1.00 |
- |
1 |
Stability QC20 top500+spatial100 |
80 |
600 |
|
1.00 |
1.00 |
1 |
RNA-only QC20 |
80 |
500 |
|
1.00 |
1.00 |
1 |
Spatial-only QC20 |
80 |
100 |
luminal-like amorphous DCIS composition |
0.98 |
0.93 |
2 |
No-coordinate QC20 |
80 |
600 |
|
1.00 |
1.00 |
1 |
Top1000 QC20 |
80 |
1100 |
|
1.00 |
1.00 |
1 |
All-nonempty top500+spatial100 |
102 |
600 |
11q13 invasive tumor composition |
0.95 |
0.95 |
1 |
Selected modules#
Stage |
Module |
Score-high label |
Anchors |
Features |
RNA/spatial |
Moran’s I |
Geary’s C |
Gene-set overlap |
|---|---|---|---|---|---|---|---|---|
Full QC20 |
|
S5 |
|
30 |
23/7 |
0.758 |
0.270 |
DCIS apocrine-luminal; 11q13 |
Stability QC20 |
|
S5 |
|
30 |
23/7 |
0.756 |
0.270 |
DCIS apocrine-luminal; 11q13 |
RNA-only QC20 |
|
S5 |
|
30 |
30/0 |
0.744 |
0.276 |
DCIS apocrine-luminal; 11q13 |
No-coordinate QC20 |
|
S5 |
|
30 |
23/7 |
0.756 |
0.270 |
DCIS apocrine-luminal; 11q13 |
Spatial-only QC20 |
|
S5 |
luminal-like amorphous DCIS fractions |
30 |
0/30 |
0.887 |
0.162 |
composition module |
Spatial-only QC20 |
|
S5 |
contour compactness |
16 |
0/16 |
0.078 |
0.892 |
geometry module |
Top1000 QC20 |
|
S5 |
|
30 |
23/7 |
0.766 |
0.261 |
DCIS apocrine-luminal |
All-nonempty |
|
S1 |
11q13 invasive tumor fractions |
30 |
20/10 |
0.628 |
0.380 |
QC sensitivity module |
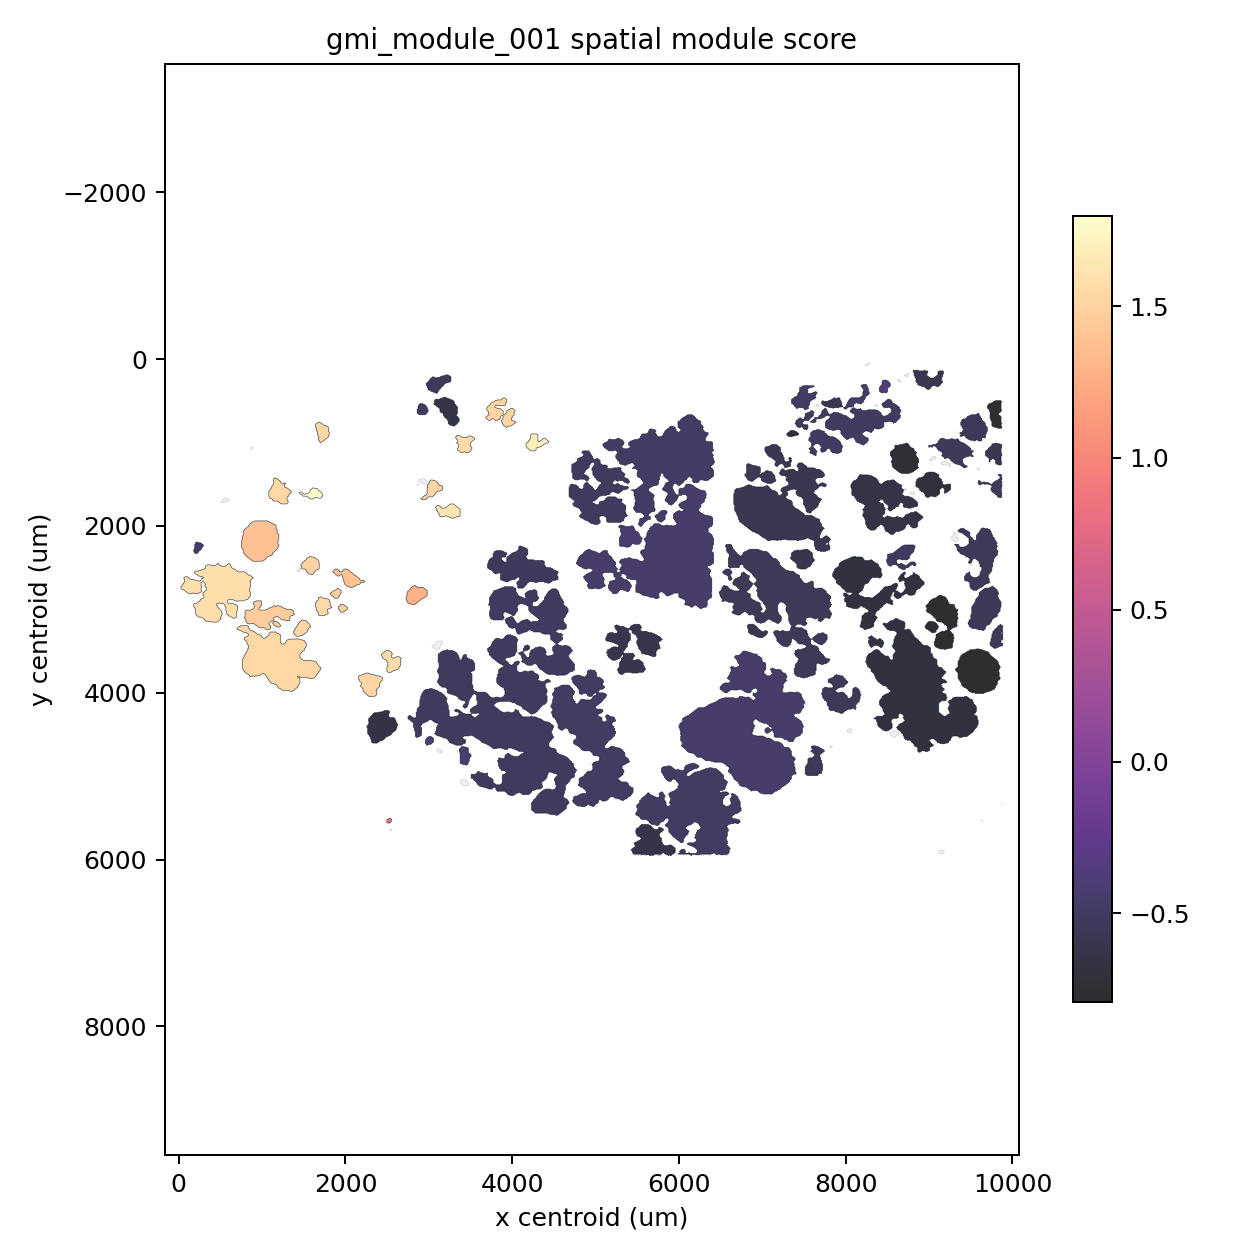
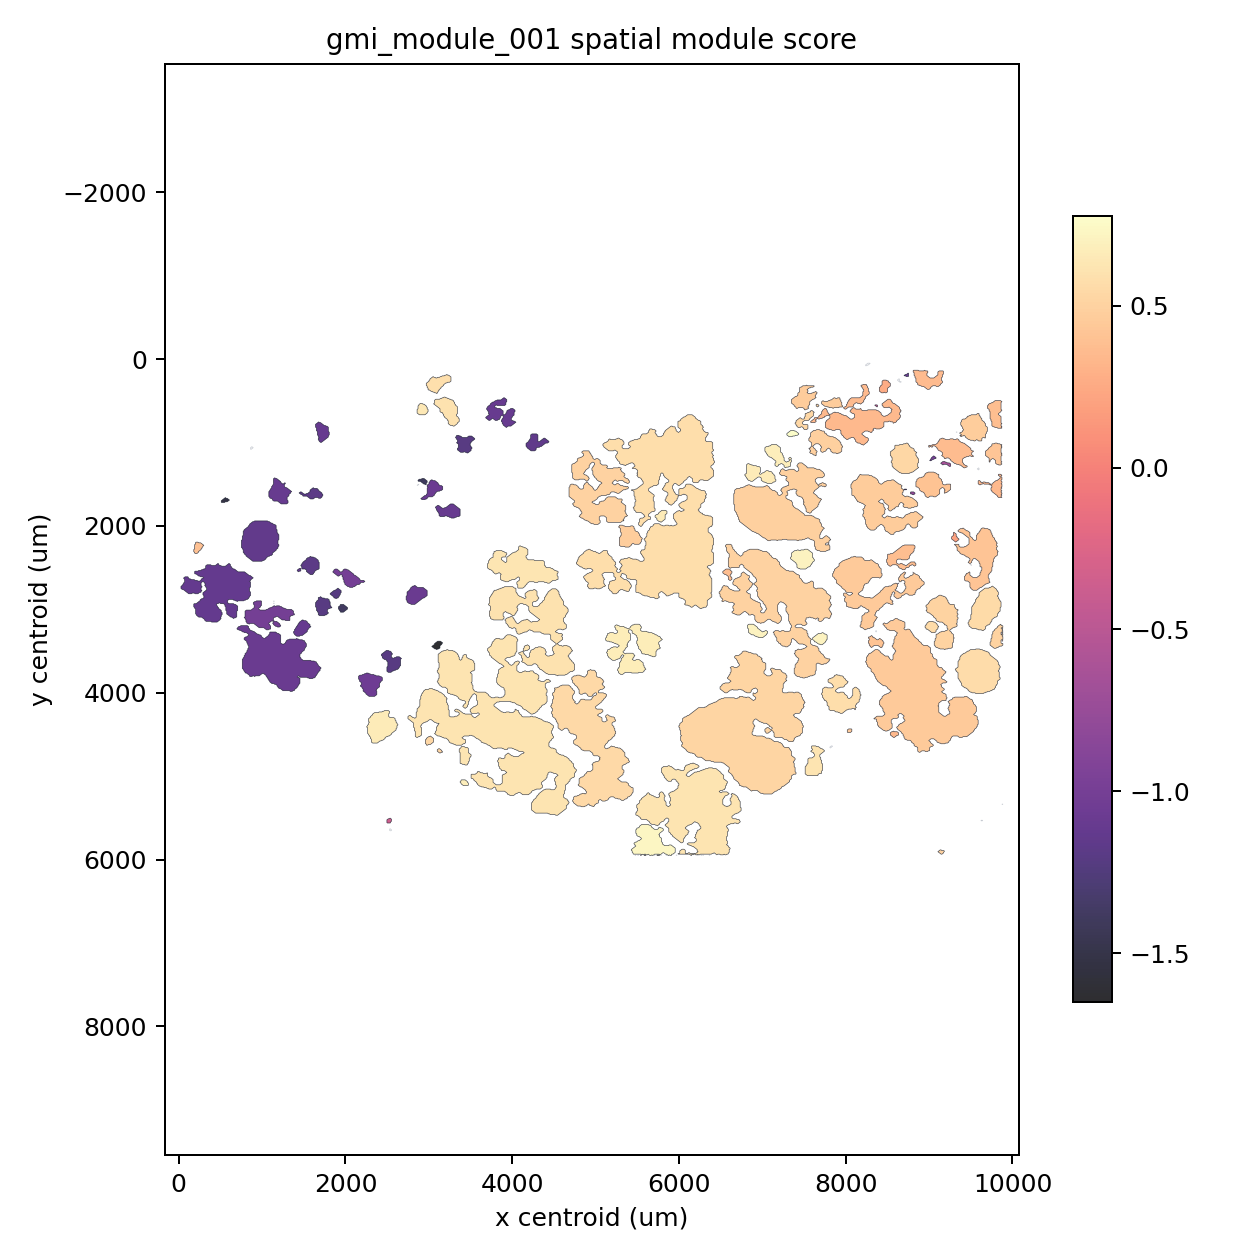
Representative module maps#
The primary QC20 module is a spatially autocorrelated S5/DCIS module anchored by
NIBAN1 and SORL1.

The RNA-only and no-coordinate controls retain the same S5/DCIS module pattern. This argues that the primary module is carried by expression structure rather than direct slide coordinates.

The spatial-only run is predictive, but its leading module is driven by luminal-like amorphous DCIS composition across the whole contour, inner rim, and core. It should be interpreted as contour context rather than an independent RNA program.

The top1000 sensitivity keeps the same S5/DCIS axis and adds EFHD1 as an
expanded RNA-budget anchor.

The all-nonempty sensitivity changes the sparse model: when contours with at least one cell are allowed, the module shifts toward S1 11q13 invasive tumor composition. This is a QC sensitivity warning and does not replace the QC20 primary model.
Biological interpretation#
The release-level interpretation is that the QC20 S1 invasive tumor/CAF versus
S5 apocrine-luminal DCIS contrast is primarily an S5/DCIS RNA expression module
anchored by NIBAN1 and SORL1. The module survives both RNA-only and
no-coordinate validation, so it is not explained away by direct coordinate
features or by the spatial feature block.
The spatial-only result is informative but different: it recovers a strong luminal-like amorphous DCIS composition module, with no evidence that coordinate features are the main driver. This means spatial contour context predicts the endpoint, but the biological claim should be phrased as endpoint composition and microanatomic context, not as a separate CAF/ECM, vascular, immune, or coordinate artifact.
The expanded top1000 run supports the same S5/DCIS program and introduces
EFHD1, consistent with an apocrine/luminal DCIS expression axis. Bootstrap
stability remains strongest for NIBAN1 and SORL1 (0.7 and 0.5 selection
frequency in the stability stage), with weaker one-off support for CCND1,
EFHD1, and several additional genes.
The all-nonempty sensitivity is deliberately not the primary result. It admits 102 contours instead of the QC20 set of 80 and switches the selected module to S1 11q13 invasive tumor composition. That change shows why 0-cell and very low-cell contours should remain excluded from the main GMI fit: they can let composition features dominate the sparse model.
CAF/ECM remodeling, angiogenesis/pericyte, myeloid-vascular context, Notch, IGF/MAPK, Wnt, TGF-beta, CXCL12/CXCR4, and CSF1/CSF1R were not selected as primary module drivers in this WTA breast validation. They remain useful candidate gene-set annotations for larger cohorts, perturbation studies, or multi-region validation.