

pyXenium.mechanostress Atera/PDC tutorial#
This tutorial runs the canonical pyXenium.mechanostress workflow on the Atera
WTA FFPE breast cancer Xenium export. The public ReadTheDocs page shows a saved
snapshot from the full-data run; the same notebook can be rerun on PDC with the
scripts in benchmarking/mechanostress_pdc/.
The biological unit here is not a contour. We reuse the S1/S5 panel from the
contour tutorial to define an interpretable tumor-DCIS/stroma mechanical
context: S1 invasive tumor cells plus S5 apocrine/luminal DCIS are treated as
tumor, S1 invasive CAFs are treated as stromal, and the main workflow focuses
on S1 CAF axis strength. A separate comparison below contrasts the available
CAF/fibroblast pools (S1_CAF, S4_CAF, and S3_CXCL14_fibroblast); the Atera
annotation does not contain a literal S5 CAF group.
from __future__ import annotations

import json
import os
from pathlib import Path

import matplotlib.pyplot as plt
import pandas as pd
from IPython.display import Image, Markdown, display

import pyXenium
from pyXenium.io import read_xenium
from pyXenium.mechanostress import (
    AxisStrengthConfig,
    MechanostressConfig,
    PolarityConfig,
    TumorStromaGrowthConfig,
    classify_tumor_stroma_growth,
    compute_ane_density,
    compute_cell_polarity,
    compute_distance_expression_coupling,
    estimate_cell_axes,
    run_mechanostress_cohort,
    run_mechanostress_workflow,
    summarize_axial_orientation,
    summarize_cell_polarity,
)

print("pyXenium", pyXenium.__version__)
pyXenium 0.4.1
Dataset and execution paths#
Default PDC input path:
/cfs/klemming/projects/supr/naiss2025-22-606/data/WTA_Preview_FFPE_Breast_Cancer_outs
Default local mirror used for this saved snapshot:
Y:\long\10X_datasets\Xenium\Atera\WTA_Preview_FFPE_Breast_Cancer_outs
ReadTheDocs does not execute this notebook. To rerun it on PDC, stage the repo and required small Xenium artifacts, bootstrap the conda env, then submit the Slurm notebook job shown near the end of the tutorial.
LOCAL_DATASET_ROOT = Path(r"Y:\long\10X_datasets\Xenium\Atera\WTA_Preview_FFPE_Breast_Cancer_outs")
PDC_DATASET_ROOT = Path("/cfs/klemming/projects/supr/naiss2025-22-606/data/WTA_Preview_FFPE_Breast_Cancer_outs")

DATASET_ROOT = Path(os.environ.get(
    "PYXENIUM_MECHANOSTRESS_DATASET_ROOT",
    LOCAL_DATASET_ROOT if LOCAL_DATASET_ROOT.exists() else PDC_DATASET_ROOT,
))
COHORT_ROOT = Path(os.environ.get("PYXENIUM_MECHANOSTRESS_COHORT_ROOT", DATASET_ROOT.parent))
SAMPLE_GLOB = os.environ.get("PYXENIUM_MECHANOSTRESS_SAMPLE_GLOB", DATASET_ROOT.name)
OUTPUT_ROOT = Path(os.environ.get("PYXENIUM_MECHANOSTRESS_OUTPUT_ROOT", DATASET_ROOT / "pyxenium_tutorial_outputs" / "mechanostress_atera_pdc"))
DEFAULT_STATIC_CANDIDATES = [
    Path("docs") / "_static" / "tutorials" / "mechanostress_atera_pdc",
    Path("..") / "_static" / "tutorials" / "mechanostress_atera_pdc",
]
DEFAULT_STATIC_DIR = next((path for path in DEFAULT_STATIC_CANDIDATES if path.exists()), DEFAULT_STATIC_CANDIDATES[0])
STATIC_DIR = Path(os.environ.get("PYXENIUM_MECHANOSTRESS_STATIC_DIR", DEFAULT_STATIC_DIR))
RUN_FULL_WORKFLOW = os.environ.get("PYXENIUM_MECHANOSTRESS_RUN_FULL", "0") == "1"

print("DATASET_ROOT =", DATASET_ROOT)
print("COHORT_ROOT =", COHORT_ROOT)
print("SAMPLE_GLOB =", SAMPLE_GLOB)
print("OUTPUT_ROOT =", OUTPUT_ROOT)
print("STATIC_DIR =", STATIC_DIR)
print("RUN_FULL_WORKFLOW =", RUN_FULL_WORKFLOW)
DATASET_ROOT = /cfs/klemming/projects/supr/naiss2025-22-606/data/WTA_Preview_FFPE_Breast_Cancer_outs
COHORT_ROOT = /cfs/klemming/scratch/h/hutaobo/pyxenium_mechanostress_atera_2026-04/staging
SAMPLE_GLOB = WTA_Preview_FFPE_Breast_Cancer_outs
OUTPUT_ROOT = /cfs/klemming/scratch/h/hutaobo/pyxenium_mechanostress_atera_2026-04/outputs
STATIC_DIR = /cfs/klemming/scratch/h/hutaobo/pyxenium_mechanostress_atera_2026-04/static/mechanostress_atera_pdc
RUN_FULL_WORKFLOW = True
S1/S5 annotation mapping#
The Atera cell-group table contains cell_id, group, and color. The
mechanostress workflow needs a tumor-stroma annotation and coordinates, so the
PDC preparation script writes a derived annotation CSV into the staging sample
directory.
Mapping used here:
s_class: the S1-S5 panel from the contour tutorial.mechanostress_class = Tumor: S1 invasive tumor variants and all S5 apocrine/luminal DCIS cells.mechanostress_class = Stromal: S1 invasive CAFs.mechanostress_class = Other: S2/S3/S4 non-S1/S5 context and unassigned cells.axis_pool = S1_CAF: the main workflow fibroblast axis-strength pool.CAF/fibroblast comparison pools:
S1_CAF,S4_CAF, andS3_CXCL14_fibroblast. S5 itself has no CAF label in this annotation.
S1_S5_PANEL = {
    "S1": [
        "CAFs Invasive Associated",
        "11q13 Invasive Tumor Cells",
        "11q13 Invasive Tumor Cells (G1/S)",
        "11q13 Invasive Tumor Cells (Mitotic)",
    ],
    "S2": ["Basal-like Structured DCIS Cells", "Dendritic Cells", "B Cells", "T Lymphocytes"],
    "S3": ["Mast Cells", "Myeloid Cells", "Macrophages", "CXCL14+ Fibroblasts", "Endothelial Cells", "Pericytes"],
    "S4": ["Myoepithelial Cells", "CAFs DCIS Associated", "Plasma Cells"],
    "S5": ["Apocrine Cells", "Luminal-like Amorphous DCIS Cells"],
}
LABEL_ALIASES = {
    "CAFs Invasive Associated": "CAFs, Invasive Associated",
    "CAFs DCIS Associated": "CAFs, DCIS Associated",
}
S1_TUMOR_LABELS = {
    "11q13 Invasive Tumor Cells",
    "11q13 Invasive Tumor Cells (G1/S)",
    "11q13 Invasive Tumor Cells (Mitotic)",
}


def build_atera_mechanostress_annotation(dataset_root: Path) -> pd.DataFrame:
    groups = pd.read_csv(dataset_root / "WTA_Preview_FFPE_Breast_Cancer_cell_groups.csv")
    cells = pd.read_parquet(dataset_root / "cells.parquet")[["cell_id", "x_centroid", "y_centroid"]]
    resolved_to_s = {
        LABEL_ALIASES.get(label, label): s_class
        for s_class, labels in S1_S5_PANEL.items()
        for label in labels
    }
    frame = groups.merge(cells, on="cell_id", how="left")
    frame["cluster"] = frame["group"].astype(str)
    frame["s_class"] = frame["group"].map(resolved_to_s).fillna("Unassigned")
    frame["mechanostress_class"] = "Other"
    frame.loc[frame["group"].isin(S1_TUMOR_LABELS) | frame["s_class"].eq("S5"), "mechanostress_class"] = "Tumor"
    frame.loc[frame["group"].eq("CAFs, Invasive Associated"), "mechanostress_class"] = "Stromal"
    frame["axis_pool"] = "Other"
    frame.loc[frame["group"].eq("CAFs, Invasive Associated"), "axis_pool"] = "S1_CAF"
    frame.loc[frame["group"].eq("CAFs, DCIS Associated"), "axis_pool"] = "S4_CAF"
    frame.loc[frame["group"].eq("CXCL14+ Fibroblasts"), "axis_pool"] = "S3_CXCL14_fibroblast"
    return frame

annotation_counts_path = STATIC_DIR / "s1_s5_mechanostress_annotation_counts.csv"
if annotation_counts_path.exists():
    annotation_counts = pd.read_csv(annotation_counts_path)
elif DATASET_ROOT.exists():
    annotation_counts = (
        build_atera_mechanostress_annotation(DATASET_ROOT)
        .groupby(["s_class", "mechanostress_class", "axis_pool"], dropna=False)
        .size()
        .reset_index(name="n_cells")
        .sort_values(["s_class", "mechanostress_class", "axis_pool"])
    )
else:
    raise FileNotFoundError(
        f"No saved annotation snapshot at {annotation_counts_path} and dataset root is unavailable: {DATASET_ROOT}"
    )
annotation_counts
| s_class | mechanostress_class | axis_pool | n_cells | |
|---|---|---|---|---|
| 0 | S1 | Stromal | S1_CAF | 4001 |
| 1 | S1 | Tumor | Other | 68872 |
| 2 | S2 | Other | Other | 23298 |
| 3 | S3 | Other | Other | 21754 |
| 4 | S3 | Other | S3_CXCL14_fibroblast | 4936 |
| 5 | S4 | Other | Other | 9311 |
| 6 | S4 | Other | S4_CAF | 24442 |
| 7 | S5 | Tumor | Other | 13431 |
| 8 | Unassigned | Other | Other | 12 |
One-shot workflow#
On PDC the notebook runs run_mechanostress_cohort(...) against a staging root
with one sample directory. The staging directory symlinks the immutable dataset
files and contains the derived annotation CSV. This exercises the public cohort
API and writes the fixed artifact set.
CANDIDATE_COUPLING_GENES = (
"EPCAM", "KRT8", "KRT18", "KRT19", "KRT5", "KRT14",
"ERBB2", "MKI67", "MMP11", "MUC1", "NIBAN1", "SORL1",
)
config = MechanostressConfig(
axis=AxisStrengthConfig(
er_threshold=2.0,
groupby=("axis_pool", "cluster"),
cell_query="axis_pool == 'S1_CAF'",
),
tumor_stroma=TumorStromaGrowthConfig(
annotation_col="mechanostress_class",
tumor_label="Tumor",
stroma_label="Stromal",
x_col="x_centroid",
y_col="y_centroid",
method="delaunay_hop",
),
polarity=PolarityConfig(offset_norm_threshold=0.30),
coupling_genes=CANDIDATE_COUPLING_GENES,
sample_id="Atera_WTA_Breast_S1S5",
)
CAF_AXIS_POOLS = ("S1_CAF", "S4_CAF", "S3_CXCL14_fibroblast")
CAF_POOL_LABELS = {
"S1_CAF": "S1 invasive CAF",
"S4_CAF": "S4 DCIS-associated CAF",
"S3_CXCL14_fibroblast": "S3 CXCL14+ fibroblast",
}
CAF_COMPARISON_RADIUS_UM = 100.0
def _label_caf_pool(frame: pd.DataFrame) -> pd.DataFrame:
labelled = frame.copy()
labelled["caf_pool_label"] = labelled["axis_pool"].map(CAF_POOL_LABELS).fillna(labelled["axis_pool"].astype(str))
return labelled
def _caf_sort(frame: pd.DataFrame) -> pd.DataFrame:
if frame.empty or "axis_pool" not in frame.columns:
return frame
ordered = frame.copy()
ordered["axis_pool"] = pd.Categorical(ordered["axis_pool"], categories=CAF_AXIS_POOLS, ordered=True)
sort_cols = [column for column in ("axis_pool", "radius_um", "cluster") if column in ordered.columns]
ordered = ordered.sort_values(sort_cols).reset_index(drop=True)
ordered["axis_pool"] = ordered["axis_pool"].astype(str)
return ordered
def build_caf_mechanical_comparison(result, *, er_threshold: float = 2.0) -> dict[str, pd.DataFrame]:
axes = result.cell_axes.copy()
axes = axes.loc[axes["axis_pool"].isin(CAF_AXIS_POOLS)].copy()
axes["elongation_ratio"] = pd.to_numeric(axes["elongation_ratio"], errors="coerce")
axes["er_ge_threshold"] = axes["elongation_ratio"] >= er_threshold
axes = _label_caf_pool(axes)
elongated = axes.loc[axes["er_ge_threshold"]].copy()
orientation = summarize_axial_orientation(elongated, groupby=["axis_pool", "cluster"], local_k=15)
orientation = _caf_sort(_label_caf_pool(orientation))
axis_strength = compute_ane_density(elongated, groupby=["axis_pool", "cluster"])
axis_strength = _caf_sort(_label_caf_pool(axis_strength))
polarity = result.cell_polarity.copy()
polarity = polarity.loc[polarity["axis_pool"].isin(CAF_AXIS_POOLS)].copy()
polarity = _label_caf_pool(polarity)
polarity_summary = summarize_cell_polarity(
polarity,
groupby=["axis_pool", "cluster"],
sample_id=result.summary.get("sample_id"),
)
polarity_summary = _caf_sort(_label_caf_pool(polarity_summary))
axis_counts = (
axes.groupby(["axis_pool", "cluster"], sort=False, dropna=False)
.agg(
n_caf_cells=("cell_id", "nunique"),
n_er_ge_2=("er_ge_threshold", "sum"),
er_median=("elongation_ratio", "median"),
er_q25=("elongation_ratio", lambda values: values.quantile(0.25)),
er_q75=("elongation_ratio", lambda values: values.quantile(0.75)),
)
.reset_index()
)
radius_slice = axis_strength.loc[axis_strength["radius_um"].eq(CAF_COMPARISON_RADIUS_UM)].copy()
comparison = axis_counts.merge(
orientation[["axis_pool", "cluster", "axial_rbar", "mean_axis_degrees", "local_rbar_median"]],
on=["axis_pool", "cluster"],
how="left",
).merge(
radius_slice[["axis_pool", "cluster", "ANE_density_median", "coh_median", "neigh_median"]],
on=["axis_pool", "cluster"],
how="left",
).merge(
polarity_summary[["axis_pool", "cluster", "n_cells", "polarized_fraction", "offset_norm_median", "offset_distance_median_um"]],
on=["axis_pool", "cluster"],
how="left",
suffixes=("", "_polarity"),
)
comparison = _caf_sort(_label_caf_pool(comparison))
return {
"comparison": comparison,
"orientation": orientation,
"axis_strength": axis_strength,
"polarity_summary": polarity_summary,
"axes": axes,
}
def write_caf_comparison_static(result, static_dir: Path) -> dict[str, pd.DataFrame]:
caf = build_caf_mechanical_comparison(result)
caf["comparison"].to_csv(static_dir / "caf_mechanical_comparison_summary.csv", index=False)
caf["orientation"].to_csv(static_dir / "caf_orientation_summary.csv", index=False)
caf["axis_strength"].to_csv(static_dir / "caf_axis_strength_by_radius.csv", index=False)
caf["polarity_summary"].to_csv(static_dir / "caf_polarity_summary.csv", index=False)
axes = caf["axes"].copy()
axes["caf_pool_label"] = pd.Categorical(
axes["caf_pool_label"],
categories=[CAF_POOL_LABELS[key] for key in CAF_AXIS_POOLS],
ordered=True,
)
fig, ax = plt.subplots(figsize=(7, 4))
if not axes.empty:
axes.boxplot(column="elongation_ratio", by="caf_pool_label", grid=False, rot=20, ax=ax)
fig.suptitle("")
ax.set_xlabel("CAF/fibroblast pool")
ax.set_ylabel("Nucleus elongation ratio")
ax.set_title("CAF elongation ratio by annotation pool")
fig.tight_layout()
fig.savefig(static_dir / "caf_er_distribution.png", dpi=180)
plt.close(fig)
plt.figure(figsize=(7, 4))
for axis_pool, group in caf["axis_strength"].groupby("axis_pool", sort=False):
group = group.sort_values("radius_um")
plt.plot(group["radius_um"], group["ANE_density_median"], marker="o", label=CAF_POOL_LABELS.get(axis_pool, axis_pool))
plt.xscale("log")
plt.xlabel("Radius (um)")
plt.ylabel("Median ANE density")
plt.title("CAF axial neighborhood density by radius")
plt.legend(frameon=False, fontsize=8)
plt.tight_layout()
plt.savefig(static_dir / "caf_axis_strength_by_radius.png", dpi=180)
plt.close()
plt.figure(figsize=(7, 4))
local = caf["comparison"].copy()
if not local.empty:
plt.bar(local["caf_pool_label"], local["local_rbar_median"], color=["#2F6F8F", "#4A9D67", "#D9822B"])
plt.ylabel("Median local axial Rbar")
plt.title("Local axial coherence across CAF pools")
plt.xticks(rotation=20, ha="right")
plt.tight_layout()
plt.savefig(static_dir / "caf_local_rbar_comparison.png", dpi=180)
plt.close()
fig, axes_plot = plt.subplots(1, 2, figsize=(9, 4))
polarity = caf["comparison"].copy()
if not polarity.empty:
axes_plot[0].bar(polarity["caf_pool_label"], polarity["offset_norm_median"], color="#8E6BBE")
axes_plot[1].bar(polarity["caf_pool_label"], polarity["polarized_fraction"], color="#C43C39")
axes_plot[0].set_ylabel("Median offset norm")
axes_plot[1].set_ylabel("Polarized fraction")
for axis in axes_plot:
axis.tick_params(axis="x", rotation=20)
for label in axis.get_xticklabels():
label.set_ha("right")
fig.suptitle("CAF polarity across annotation pools")
fig.tight_layout()
fig.savefig(static_dir / "caf_polarity_comparison.png", dpi=180)
plt.close(fig)
return caf
def _best_pool(table: pd.DataFrame, column: str) -> str | None:
if table.empty or column not in table.columns:
return None
values = pd.to_numeric(table[column], errors="coerce")
if values.notna().sum() == 0:
return None
return str(table.loc[values.idxmax(), "caf_pool_label"])
def write_tutorial_static(result, annotation: pd.DataFrame, static_dir: Path, candidate_genes: tuple[str, ...]) -> None:
static_dir.mkdir(parents=True, exist_ok=True)
counts = (
annotation.groupby(["s_class", "mechanostress_class", "axis_pool"], dropna=False)
.size()
.reset_index(name="n_cells")
.sort_values(["s_class", "mechanostress_class", "axis_pool"])
)
counts.to_csv(static_dir / "s1_s5_mechanostress_annotation_counts.csv", index=False)
available = set(result.distance_expression_coupling["gene"].astype(str)) if not result.distance_expression_coupling.empty else set()
pd.DataFrame({"gene": candidate_genes, "available": [gene in available for gene in candidate_genes]}).to_csv(
static_dir / "coupling_gene_availability.csv", index=False
)
for name, table in result.table_map().items():
if name in {"axis_strength_by_radius", "orientation_summary", "tumor_growth_summary", "distance_expression_coupling", "polarity_summary"}:
table.to_csv(static_dir / f"{name}.csv", index=False)
caf = write_caf_comparison_static(result, static_dir)
summary = result.summary.copy()
summary["available_coupling_genes"] = [gene for gene in candidate_genes if gene in available]
summary["missing_coupling_genes"] = [gene for gene in candidate_genes if gene not in available]
summary["caf_comparison"] = {
"highest_er_median": _best_pool(caf["comparison"], "er_median"),
"highest_local_rbar_median": _best_pool(caf["comparison"], "local_rbar_median"),
"highest_ane_density_100um": _best_pool(caf["comparison"], "ANE_density_median"),
"highest_offset_norm_median": _best_pool(caf["comparison"], "offset_norm_median"),
}
(static_dir / "summary.json").write_text(json.dumps(result.summary, indent=2, default=str) + "\n", encoding="utf-8")
(static_dir / "tutorial_summary.json").write_text(json.dumps(summary, indent=2, default=str) + "\n", encoding="utf-8")
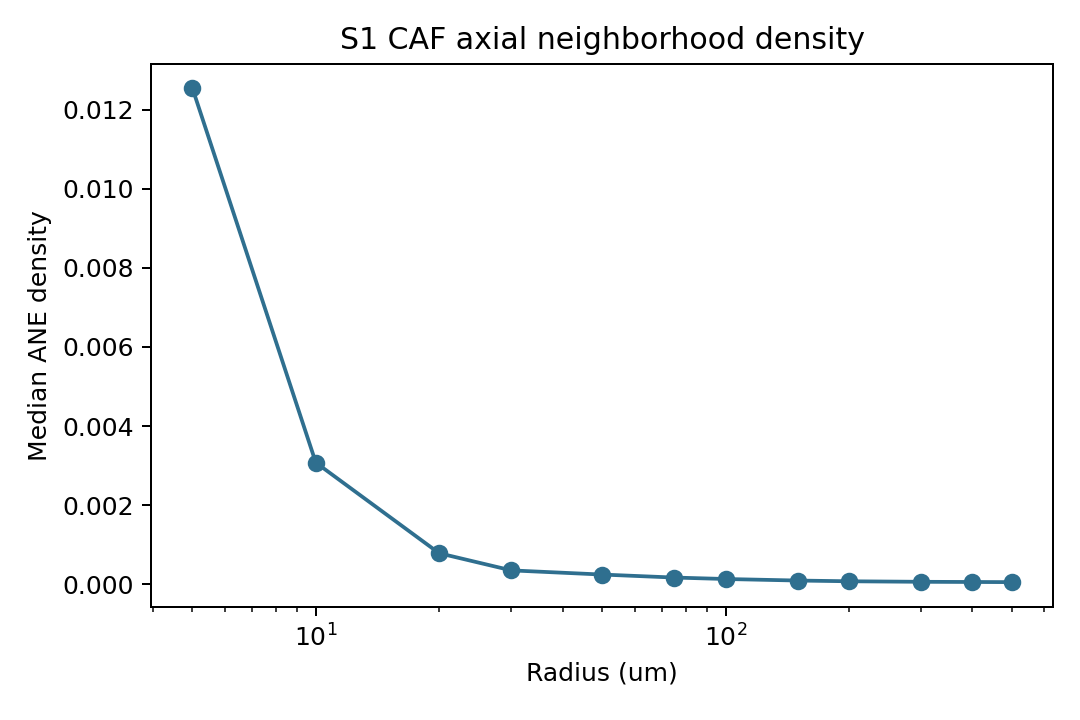
axis = result.axis_strength_by_radius.sort_values("radius_um")
plt.figure(figsize=(6, 4))
if not axis.empty:
plt.plot(axis["radius_um"], axis["ANE_density_median"], marker="o", color="#2F6F8F")
plt.xscale("log")
plt.xlabel("Radius (um)")
plt.ylabel("Median ANE density")
plt.title("S1 CAF axial neighborhood density")
plt.tight_layout()
plt.savefig(static_dir / "axis_strength_density.png", dpi=180)
plt.close()
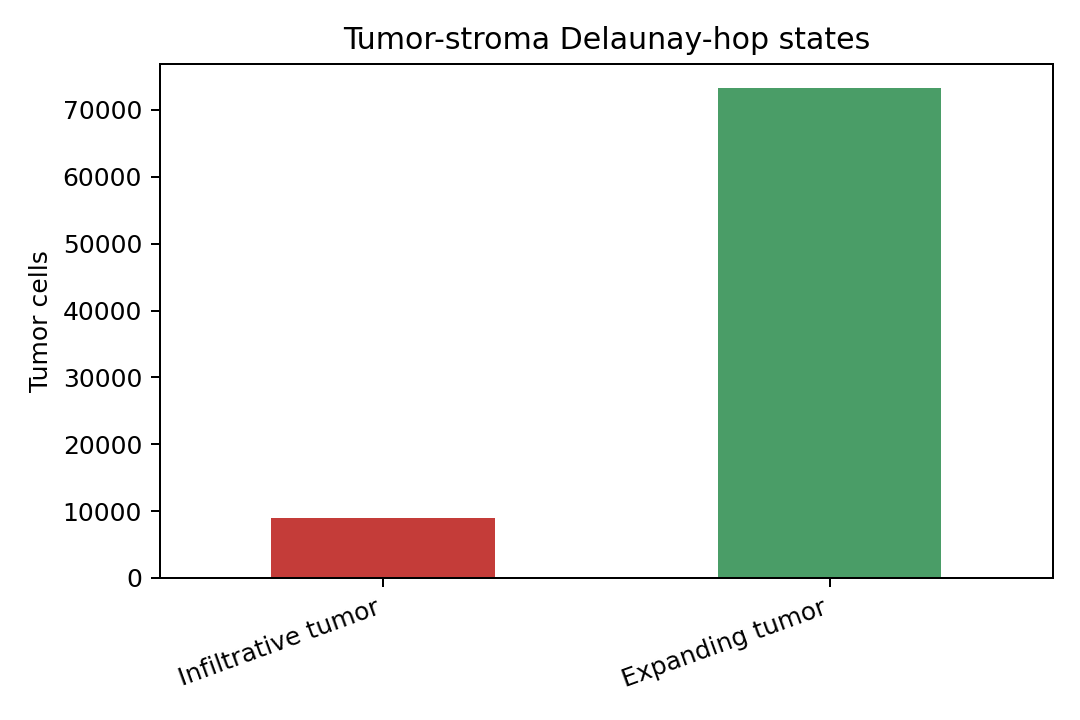
plt.figure(figsize=(6, 4))
if not result.tumor_growth_summary.empty:
row = result.tumor_growth_summary.iloc[0]
vals = pd.Series({"Infiltrative tumor": row.get("n_infiltrative", 0), "Expanding tumor": row.get("n_expanding", 0)})
vals.plot(kind="bar", color=["#C43C39", "#4A9D67"])
plt.ylabel("Tumor cells")
plt.title("Tumor-stroma Delaunay-hop states")
plt.xticks(rotation=20, ha="right")
plt.tight_layout()
plt.savefig(static_dir / "tumor_growth_states.png", dpi=180)
plt.close()
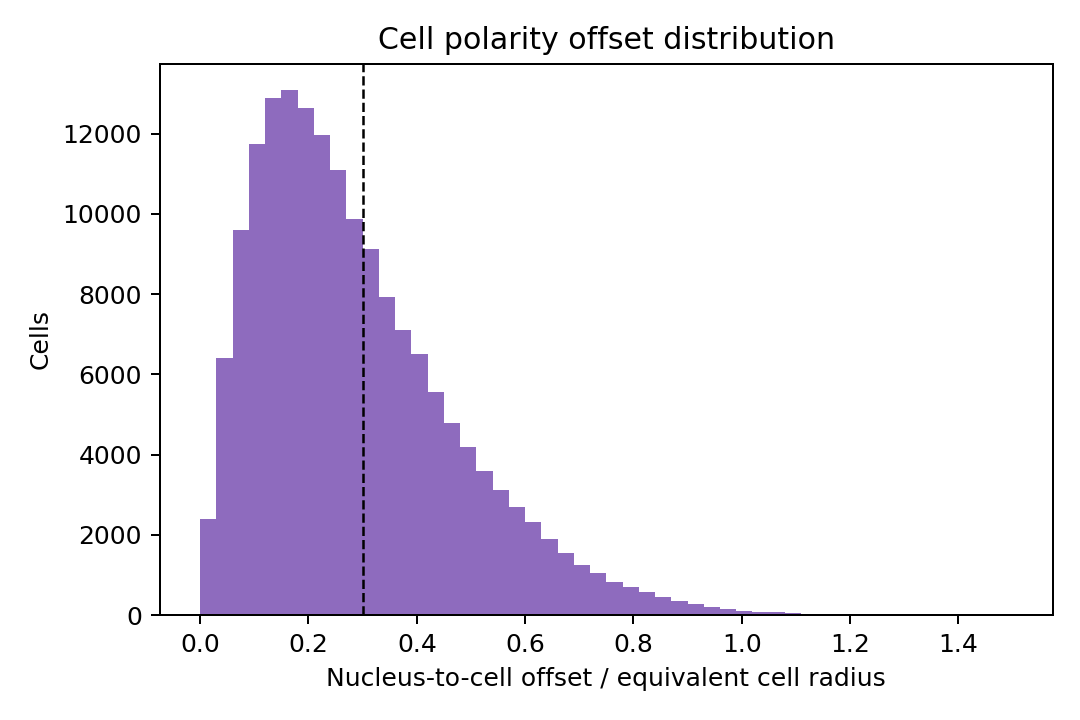
plt.figure(figsize=(6, 4))
if not result.cell_polarity.empty:
result.cell_polarity["offset_norm"].dropna().clip(upper=1.5).plot(kind="hist", bins=50, color="#8E6BBE")
plt.axvline(0.30, color="black", linestyle="--", linewidth=1)
plt.xlabel("Nucleus-to-cell offset / equivalent cell radius")
plt.ylabel("Cells")
plt.title("Cell polarity offset distribution")
plt.tight_layout()
plt.savefig(static_dir / "polarity_offset_histogram.png", dpi=180)
plt.close()
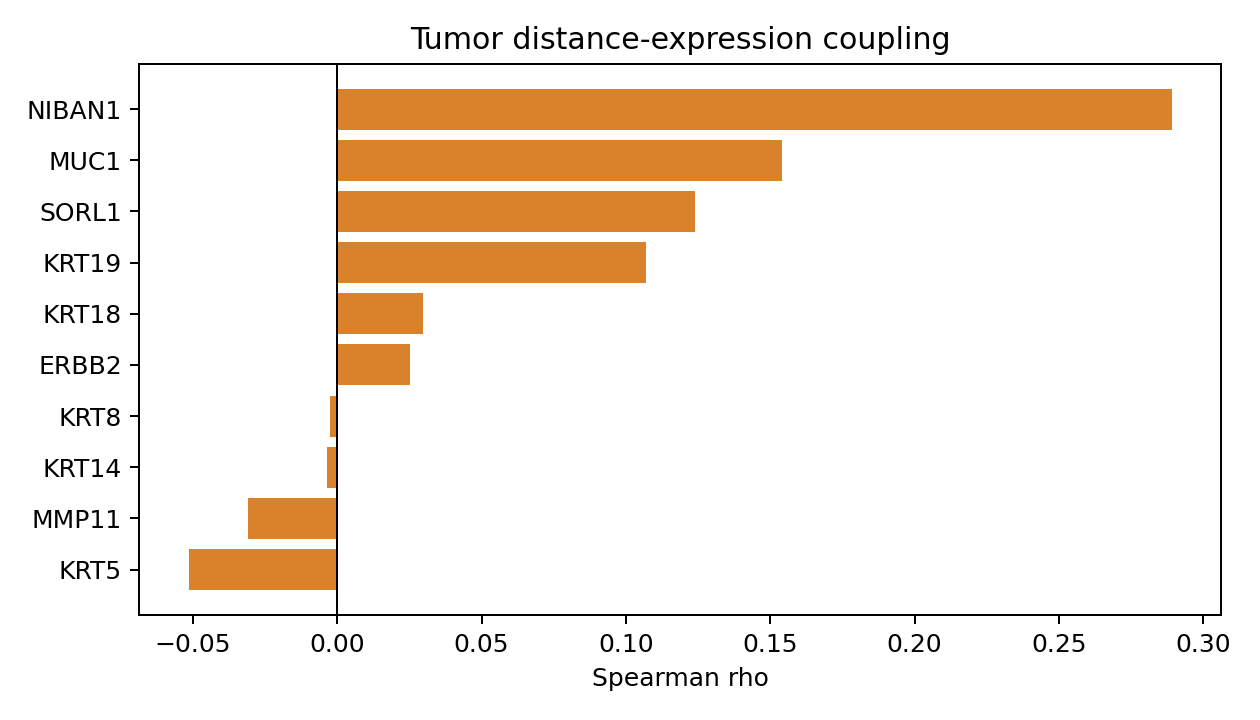
plt.figure(figsize=(7, 4))
if not result.distance_expression_coupling.empty:
top = result.distance_expression_coupling.sort_values("spearman_rho").tail(10)
plt.barh(top["gene"], top["spearman_rho"], color="#D9822B")
plt.axvline(0, color="black", linewidth=0.8)
plt.xlabel("Spearman rho")
plt.title("Tumor distance-expression coupling")
plt.tight_layout()
plt.savefig(static_dir / "distance_expression_coupling.png", dpi=180)
plt.close()
if RUN_FULL_WORKFLOW:
cohort_result = run_mechanostress_cohort(
COHORT_ROOT,
output_dir=OUTPUT_ROOT,
config=config.copy_with(sample_id=None),
sample_glob=SAMPLE_GLOB,
annotation_glob="*_cell_clusters_with_annotation_and_coord.csv",
prefer="h5",
fail_fast=True,
)
result = next(iter(cohort_result.results.values()))
write_tutorial_static(result, build_atera_mechanostress_annotation(DATASET_ROOT), STATIC_DIR, CANDIDATE_COUPLING_GENES)
display(cohort_result.summary)
else:
display(Markdown("Using saved tutorial snapshot. Set `PYXENIUM_MECHANOSTRESS_RUN_FULL=1` to rerun the full PDC workflow."))
| sample_id | n_axes | n_axis_strength_rows | n_orientation_summary_rows | n_tumor_growth_cells | n_distance_expression_coupling_rows | n_polarity_cells | tumor_growth.sample_id | tumor_growth.n_tumor | tumor_growth.n_infiltrative | tumor_growth.n_expanding | tumor_growth.n_tumor_valid | tumor_growth.infiltrative_proportion | tumor_growth.mean_infil_dist_to_stromal | tumor_growth.mean_expand_dist_to_stromal | |
|---|---|---|---|---|---|---|---|---|---|---|---|---|---|---|---|
| 0 | WTA_Preview_FFPE_Breast_Cancer_outs | 168335 | 12 | 1 | 170057 | 12 | 168335 | WTA_Preview_FFPE_Breast_Cancer_outs | 82303 | 9026 | 73277 | 82303 | 0.109668 | 33.619929 | 124.810325 |
Step-by-step public API#
The same workflow can be decomposed into public functions for teaching and debugging. This cell is intentionally explicit: it shows where axes, ANE density, tumor-stroma growth calls, polarity, and expression coupling enter the result.
if RUN_FULL_WORKFLOW:
    annotation = build_atera_mechanostress_annotation(DATASET_ROOT)
    slide = read_xenium(DATASET_ROOT, as_="slide", prefer="h5", include_transcripts=False, include_boundaries=True)

    axes = estimate_cell_axes(slide.shapes["nucleus_boundaries"])
    axes = axes.merge(annotation[["cell_id", "cluster", "s_class", "mechanostress_class", "axis_pool"]], on="cell_id", how="left")
    s1_caf_axes = axes.query("axis_pool == 'S1_CAF' and elongation_ratio >= 2.0").copy()
    orientation_summary = summarize_axial_orientation(s1_caf_axes, groupby=["axis_pool", "cluster"], local_k=15)
    axis_strength = compute_ane_density(s1_caf_axes, groupby=["axis_pool", "cluster"])

    growth = classify_tumor_stroma_growth(
        annotation,
        annotation_col="mechanostress_class",
        tumor_label="Tumor",
        stroma_label="Stromal",
        x_col="x_centroid",
        y_col="y_centroid",
        method="delaunay_hop",
    )
    polarity = compute_cell_polarity(cell_boundaries=slide.shapes["cell_boundaries"], nucleus_boundaries=slide.shapes["nucleus_boundaries"])
    display(orientation_summary.head())
    display(axis_strength.head())
    display(growth.head())
    display(polarity.head())
else:
    display(pd.read_csv(STATIC_DIR / "orientation_summary.csv"))
    display(pd.read_csv(STATIC_DIR / "axis_strength_by_radius.csv").head())
| axis_pool | cluster | n_axes | axial_rbar | mean_axis_degrees | kappa | rayleigh_p | local_rbar_median | local_rbar_q25 | local_rbar_q75 | local_rbar_n_cells | |
|---|---|---|---|---|---|---|---|---|---|---|---|
| 0 | S1_CAF | CAFs, Invasive Associated | 2493 | 0.073272 | 52.045082 | 0.146938 | 0.000002 | 0.448844 | 0.27453 | 0.641602 | 2493 |
| axis_pool | cluster | radius_um | coh_median | coh_q25 | coh_q75 | coh_n_cells | neigh_median | neigh_q25 | neigh_q75 | neigh_n_cells | ANE_median | ANE_q25 | ANE_q75 | ANE_density_median | ANE_density_q25 | ANE_density_q75 | |
|---|---|---|---|---|---|---|---|---|---|---|---|---|---|---|---|---|---|
| 0 | S1_CAF | CAFs, Invasive Associated | 5.0 | 0.984708 | 0.963206 | 0.998091 | 48 | 0.0 | 0.0 | 0.0 | 2493 | 0.984708 | 0.963206 | 0.998091 | 0.012538 | 0.012264 | 0.012708 |
| 1 | S1_CAF | CAFs, Invasive Associated | 10.0 | 0.961127 | 0.885093 | 0.992598 | 324 | 0.0 | 0.0 | 0.0 | 2493 | 0.966694 | 0.885435 | 0.995921 | 0.003077 | 0.002818 | 0.003170 |
| 2 | S1_CAF | CAFs, Invasive Associated | 20.0 | 0.951273 | 0.857285 | 0.985468 | 1037 | 0.0 | 0.0 | 1.0 | 2493 | 0.988742 | 0.911577 | 1.749390 | 0.000787 | 0.000725 | 0.001392 |
| 3 | S1_CAF | CAFs, Invasive Associated | 30.0 | 0.931270 | 0.807942 | 0.978386 | 1539 | 1.0 | 0.0 | 2.0 | 2493 | 0.999741 | 0.936074 | 1.990397 | 0.000354 | 0.000331 | 0.000704 |
| 4 | S1_CAF | CAFs, Invasive Associated | 50.0 | 0.883856 | 0.713222 | 0.959852 | 2066 | 2.0 | 1.0 | 4.0 | 2493 | 1.948850 | 0.990393 | 3.410119 | 0.000248 | 0.000126 | 0.000434 |
| cell_id | group | color | x_centroid | y_centroid | cluster | s_class | mechanostress_class | axis_pool | stroma_hop | tumor_growth_pattern | dist_to_nearest_stromal | dist_to_nearest_tumor | |
|---|---|---|---|---|---|---|---|---|---|---|---|---|---|
| 0 | cgmkdohb-1 | Endothelial Cells | #795548 | 988.603394 | 2998.515625 | Endothelial Cells | S3 | Other | Other | NaN | NaN | NaN | NaN |
| 1 | cgmhpeak-1 | Luminal-like Amorphous DCIS Cells | #F943D2 | 920.002380 | 2998.296631 | Luminal-like Amorphous DCIS Cells | S5 | Tumor | Other | 5.0 | expanding | 120.829583 | 15.598983 |
| 2 | cgngakjk-1 | Pericytes | #8D8D00 | 852.635254 | 2999.503418 | Pericytes | S3 | Other | Other | NaN | NaN | NaN | NaN |
| 3 | cgoclelb-1 | Luminal-like Amorphous DCIS Cells | #F943D2 | 951.682922 | 2902.430908 | Luminal-like Amorphous DCIS Cells | S5 | Tumor | Other | 4.0 | expanding | 128.512396 | 6.777092 |
| 4 | cglinfcj-1 | Luminal-like Amorphous DCIS Cells | #F943D2 | 961.724487 | 2932.555420 | Luminal-like Amorphous DCIS Cells | S5 | Tumor | Other | 2.0 | expanding | 100.771389 | 13.086734 |
| cell_id | cell_centroid_x | cell_centroid_y | cell_area | cell_equivalent_radius_um | nucleus_centroid_x | nucleus_centroid_y | nucleus_area | nucleus_equivalent_radius_um | polarity_dx | polarity_dy | offset_distance_um | offset_norm | polarity_angle_degrees | polarized | |
|---|---|---|---|---|---|---|---|---|---|---|---|---|---|---|---|
| 0 | aaaajgij-1 | 73.522306 | 2732.760381 | 78.205039 | 4.989332 | 73.530805 | 2731.893369 | 58.631144 | 4.320055 | 0.008500 | -0.867012 | 0.867053 | 0.173781 | 270.561682 | False |
| 1 | aaaandia-1 | 153.385380 | 2721.124277 | 109.292873 | 5.898220 | 153.053891 | 2722.042227 | 82.991347 | 5.139744 | -0.331489 | 0.917949 | 0.975969 | 0.165468 | 109.855600 | False |
| 2 | aaabalki-1 | 15.698925 | 2817.272773 | 52.783643 | 4.098970 | 15.214442 | 2816.992275 | 30.884517 | 3.135418 | -0.484482 | -0.280498 | 0.559823 | 0.136577 | 210.069315 | False |
| 3 | aaabchln-1 | 14.746960 | 2799.108926 | 40.998806 | 3.612523 | 14.687462 | 2799.729375 | 28.243618 | 2.998370 | -0.059498 | 0.620449 | 0.623295 | 0.172537 | 95.477623 | False |
| 4 | aaaccnnp-1 | 58.715848 | 2763.223232 | 47.342835 | 3.881970 | 58.545854 | 2762.925723 | 38.921874 | 3.519832 | -0.169994 | -0.297510 | 0.342651 | 0.088267 | 240.256815 | False |
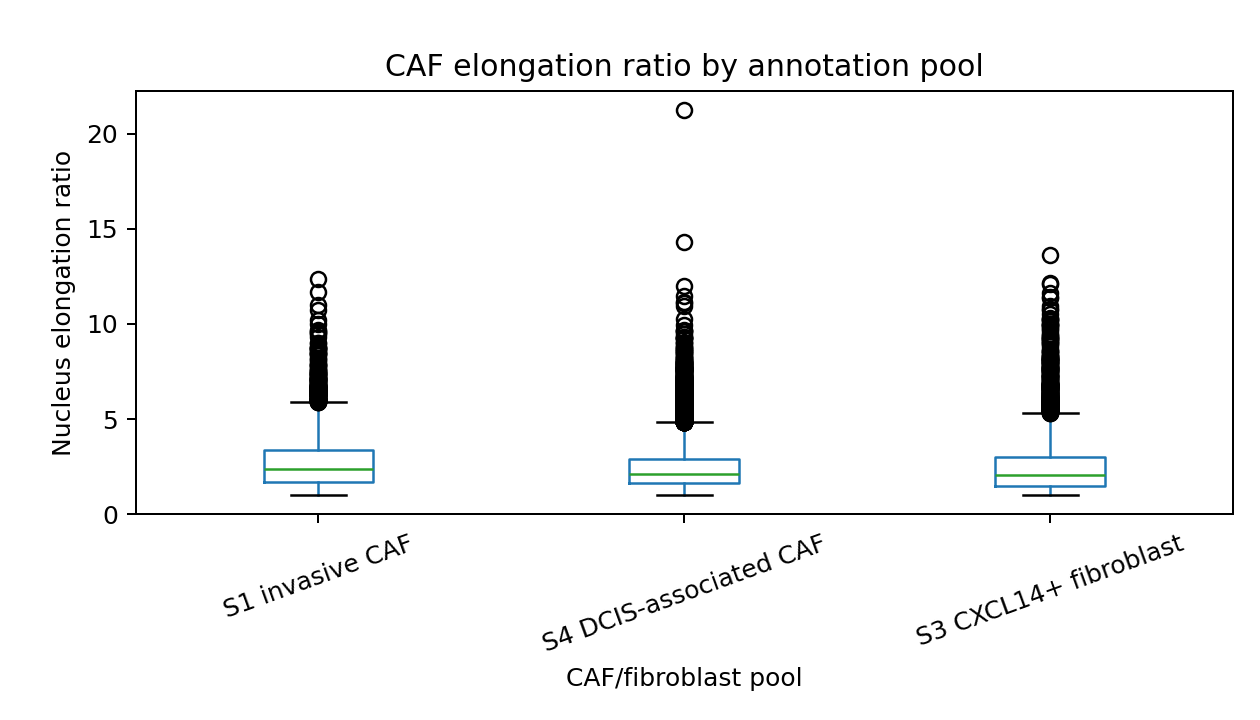
CAF mechanical-state comparison#
The Atera annotation does not contain a literal S5_CAF group. S5 in this
panel is apocrine/luminal DCIS tumor context. For CAF biology, this section
therefore compares the available annotated CAF/fibroblast pools: invasive
S1_CAF, DCIS-associated S4_CAF, and S3_CXCL14_fibroblast.
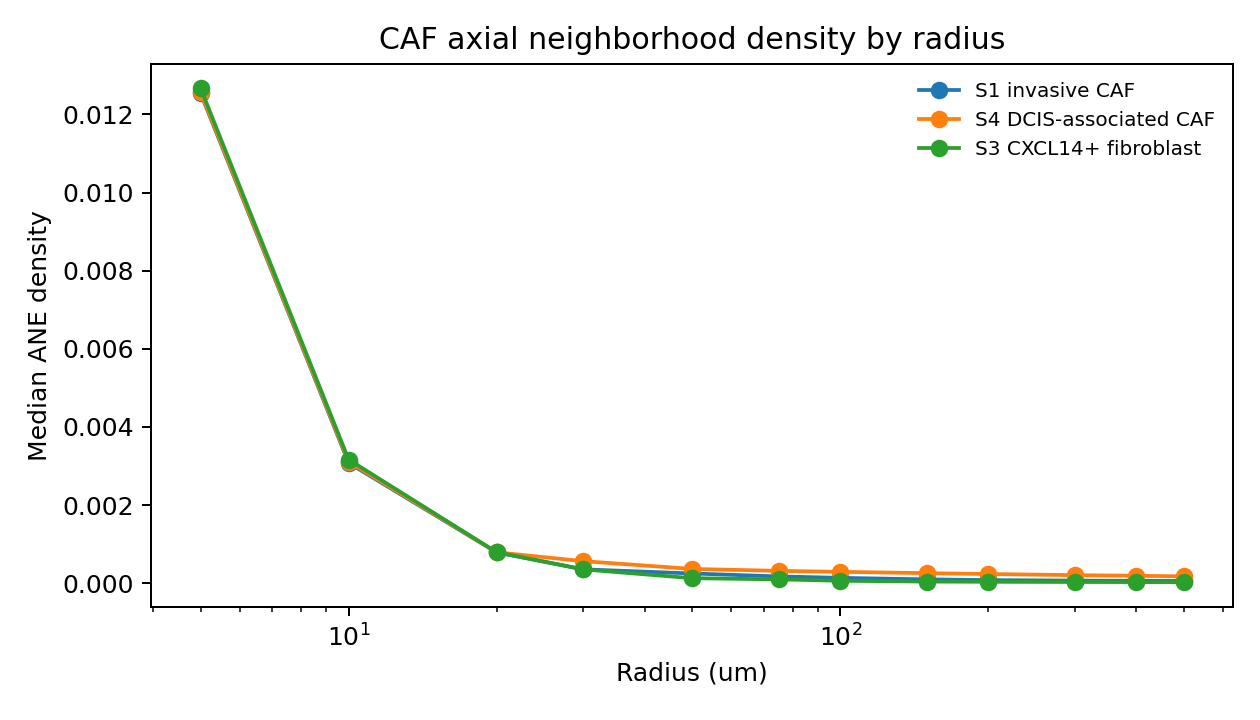
The comparison uses cells with elongation_ratio >= 2.0 for axial orientation
and ANE density. Polarity is summarized on all cells in each CAF/fibroblast
pool.
caf_summary = pd.read_csv(STATIC_DIR / "caf_mechanical_comparison_summary.csv")
caf_axis_strength = pd.read_csv(STATIC_DIR / "caf_axis_strength_by_radius.csv")
caf_orientation = pd.read_csv(STATIC_DIR / "caf_orientation_summary.csv")
caf_polarity = pd.read_csv(STATIC_DIR / "caf_polarity_summary.csv")

metric_labels = {
    "er_median": "median elongation ratio",
    "local_rbar_median": "median local axial Rbar",
    "ANE_density_median": "median ANE density at 100 um",
    "offset_norm_median": "median polarity offset norm",
}
for column, label in metric_labels.items():
    source = caf_summary
    if column == "ANE_density_median":
        source = caf_axis_strength.loc[caf_axis_strength["radius_um"].eq(CAF_COMPARISON_RADIUS_UM)]
    values = pd.to_numeric(source[column], errors="coerce")
    if values.notna().any():
        row = source.loc[values.idxmax()]
        print(f"Highest {label}: {row['caf_pool_label']} ({values.max():.4g})")

display(caf_summary[[
    "axis_pool", "caf_pool_label", "n_caf_cells", "n_er_ge_2", "er_median",
    "local_rbar_median", "ANE_density_median", "offset_norm_median", "polarized_fraction",
]])
display(caf_axis_strength[["axis_pool", "caf_pool_label", "radius_um", "ANE_density_median", "coh_median", "neigh_median"]].head(36))
Highest median elongation ratio: S1 invasive CAF (2.356)
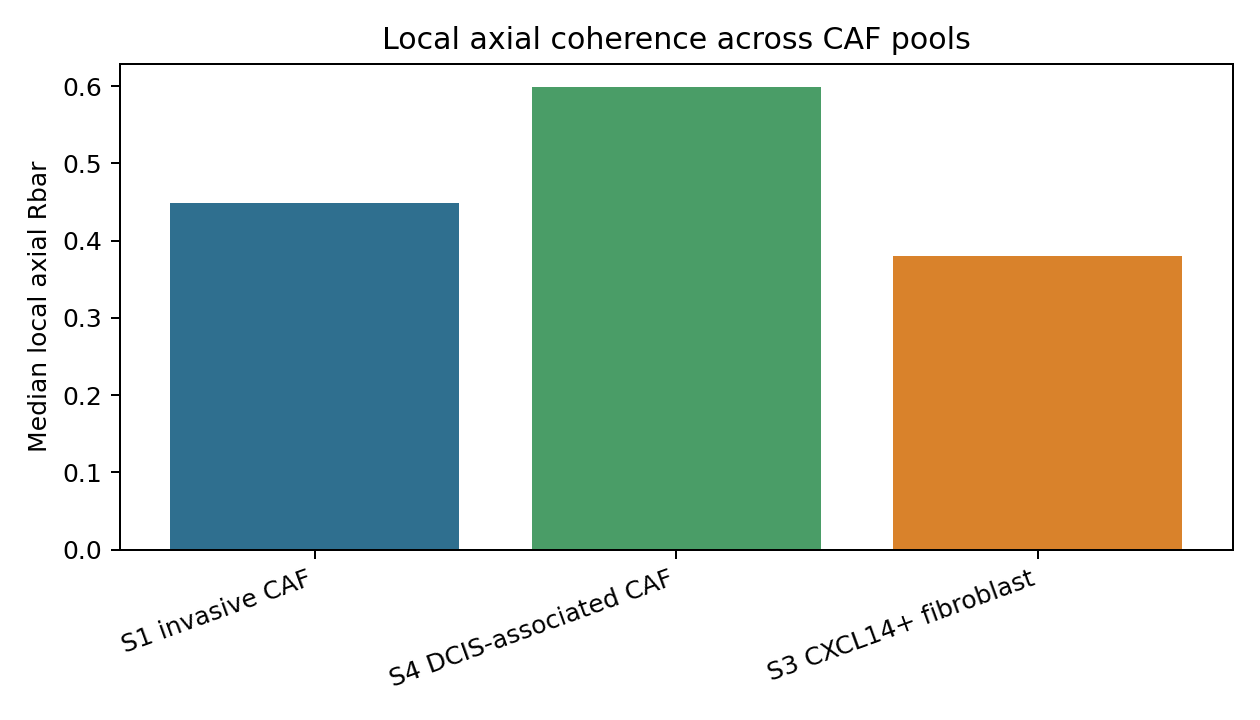
Highest median local axial Rbar: S4 DCIS-associated CAF (0.5993)
Highest median ANE density at 100 um: S4 DCIS-associated CAF (0.0002902)
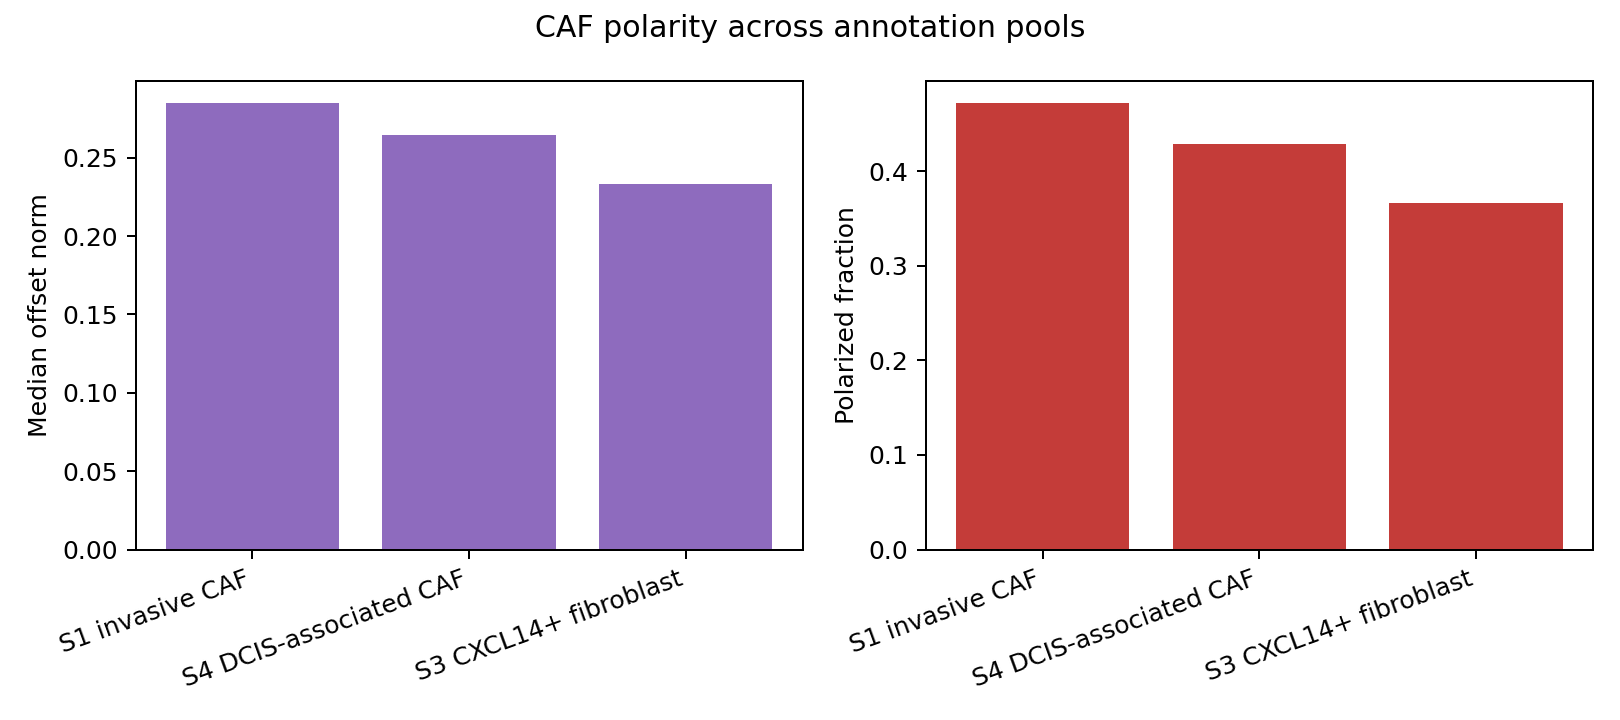
Highest median polarity offset norm: S1 invasive CAF (0.2847)
| axis_pool | caf_pool_label | n_caf_cells | n_er_ge_2 | er_median | local_rbar_median | ANE_density_median | offset_norm_median | polarized_fraction | |
|---|---|---|---|---|---|---|---|---|---|
| 0 | S1_CAF | S1 invasive CAF | 3999 | 2493 | 2.356217 | 0.448844 | 0.000136 | 0.284690 | 0.471618 |
| 1 | S4_CAF | S4 DCIS-associated CAF | 24376 | 13460 | 2.120415 | 0.599311 | 0.000290 | 0.264185 | 0.428659 |
| 2 | S3_CXCL14_fibroblast | S3 CXCL14+ fibroblast | 4504 | 2307 | 2.039332 | 0.379728 | 0.000061 | 0.233226 | 0.366785 |
| axis_pool | caf_pool_label | radius_um | ANE_density_median | coh_median | neigh_median | |
|---|---|---|---|---|---|---|
| 0 | S1_CAF | S1 invasive CAF | 5.0 | 0.012538 | 0.984708 | 0.0 |
| 1 | S1_CAF | S1 invasive CAF | 10.0 | 0.003077 | 0.961127 | 0.0 |
| 2 | S1_CAF | S1 invasive CAF | 20.0 | 0.000787 | 0.951273 | 0.0 |
| 3 | S1_CAF | S1 invasive CAF | 30.0 | 0.000354 | 0.931270 | 1.0 |
| 4 | S1_CAF | S1 invasive CAF | 50.0 | 0.000248 | 0.883856 | 2.0 |
| 5 | S1_CAF | S1 invasive CAF | 75.0 | 0.000172 | 0.826181 | 4.0 |
| 6 | S1_CAF | S1 invasive CAF | 100.0 | 0.000136 | 0.773440 | 6.0 |
| 7 | S1_CAF | S1 invasive CAF | 150.0 | 0.000097 | 0.687385 | 11.0 |
| 8 | S1_CAF | S1 invasive CAF | 200.0 | 0.000078 | 0.626449 | 17.0 |
| 9 | S1_CAF | S1 invasive CAF | 300.0 | 0.000065 | 0.566703 | 34.0 |
| 10 | S1_CAF | S1 invasive CAF | 400.0 | 0.000060 | 0.544598 | 60.0 |
| 11 | S1_CAF | S1 invasive CAF | 500.0 | 0.000057 | 0.532520 | 90.0 |
| 12 | S4_CAF | S4 DCIS-associated CAF | 5.0 | 0.012570 | 0.986154 | 0.0 |
| 13 | S4_CAF | S4 DCIS-associated CAF | 10.0 | 0.003109 | 0.960382 | 0.0 |
| 14 | S4_CAF | S4 DCIS-associated CAF | 20.0 | 0.000791 | 0.921237 | 1.0 |
| 15 | S4_CAF | S4 DCIS-associated CAF | 30.0 | 0.000564 | 0.880385 | 1.0 |
| 16 | S4_CAF | S4 DCIS-associated CAF | 50.0 | 0.000364 | 0.806556 | 4.0 |
| 17 | S4_CAF | S4 DCIS-associated CAF | 75.0 | 0.000315 | 0.753477 | 8.0 |
| 18 | S4_CAF | S4 DCIS-associated CAF | 100.0 | 0.000290 | 0.720772 | 13.0 |
| 19 | S4_CAF | S4 DCIS-associated CAF | 150.0 | 0.000256 | 0.672470 | 28.0 |
| 20 | S4_CAF | S4 DCIS-associated CAF | 200.0 | 0.000234 | 0.640737 | 46.0 |
| 21 | S4_CAF | S4 DCIS-associated CAF | 300.0 | 0.000205 | 0.600152 | 98.0 |
| 22 | S4_CAF | S4 DCIS-associated CAF | 400.0 | 0.000189 | 0.582329 | 165.0 |
| 23 | S4_CAF | S4 DCIS-associated CAF | 500.0 | 0.000175 | 0.568240 | 245.0 |
| 24 | S3_CXCL14_fibroblast | S3 CXCL14+ fibroblast | 5.0 | 0.012669 | 0.995013 | 0.0 |
| 25 | S3_CXCL14_fibroblast | S3 CXCL14+ fibroblast | 10.0 | 0.003164 | 0.990143 | 0.0 |
| 26 | S3_CXCL14_fibroblast | S3 CXCL14+ fibroblast | 20.0 | 0.000793 | 0.973463 | 0.0 |
| 27 | S3_CXCL14_fibroblast | S3 CXCL14+ fibroblast | 30.0 | 0.000353 | 0.955635 | 0.0 |
| 28 | S3_CXCL14_fibroblast | S3 CXCL14+ fibroblast | 50.0 | 0.000127 | 0.927153 | 1.0 |
| 29 | S3_CXCL14_fibroblast | S3 CXCL14+ fibroblast | 75.0 | 0.000097 | 0.868155 | 1.0 |
| 30 | S3_CXCL14_fibroblast | S3 CXCL14+ fibroblast | 100.0 | 0.000061 | 0.805991 | 2.0 |
| 31 | S3_CXCL14_fibroblast | S3 CXCL14+ fibroblast | 150.0 | 0.000040 | 0.693096 | 4.0 |
| 32 | S3_CXCL14_fibroblast | S3 CXCL14+ fibroblast | 200.0 | 0.000035 | 0.638428 | 7.0 |
| 33 | S3_CXCL14_fibroblast | S3 CXCL14+ fibroblast | 300.0 | 0.000030 | 0.583079 | 15.0 |
| 34 | S3_CXCL14_fibroblast | S3 CXCL14+ fibroblast | 400.0 | 0.000028 | 0.548139 | 26.0 |
| 35 | S3_CXCL14_fibroblast | S3 CXCL14+ fibroblast | 500.0 | 0.000027 | 0.534983 | 40.0 |
Snapshot summaries#
The saved snapshot below was produced from the full Atera data. Complete large per-cell tables remain in the PDC output root; only summary tables and compact figures are kept in the documentation tree.
summary = json.loads((STATIC_DIR / "tutorial_summary.json").read_text(encoding="utf-8"))
tumor_summary = pd.read_csv(STATIC_DIR / "tumor_growth_summary.csv")
polarity_summary = pd.read_csv(STATIC_DIR / "polarity_summary.csv")
gene_availability = pd.read_csv(STATIC_DIR / "coupling_gene_availability.csv")

print(json.dumps(summary, indent=2))
display(tumor_summary)
display(polarity_summary)
display(gene_availability)
{
  "sample_id": "WTA_Preview_FFPE_Breast_Cancer_outs",
  "n_axes": 168335,
  "n_axis_strength_rows": 12,
  "n_orientation_summary_rows": 1,
  "n_tumor_growth_cells": 170057,
  "n_distance_expression_coupling_rows": 12,
  "n_polarity_cells": 168335,
  "tumor_growth": {
    "sample_id": "WTA_Preview_FFPE_Breast_Cancer_outs",
    "n_tumor": 82303,
    "n_infiltrative": 9026,
    "n_expanding": 73277,
    "n_tumor_valid": 82303,
    "infiltrative_proportion": 0.10966793434018202,
    "mean_infil_dist_to_stromal": 33.61992883561506,
    "mean_expand_dist_to_stromal": 124.81032478936972
  },
  "available_coupling_genes": [
    "EPCAM",
    "KRT8",
    "KRT18",
    "KRT19",
    "KRT5",
    "KRT14",
    "ERBB2",
    "MKI67",
    "MMP11",
    "MUC1",
    "NIBAN1",
    "SORL1"
  ],
  "missing_coupling_genes": [],
  "caf_comparison": {
    "highest_er_median": "S1 invasive CAF",
    "highest_local_rbar_median": "S4 DCIS-associated CAF",
    "highest_ane_density_100um": "S4 DCIS-associated CAF",
    "highest_offset_norm_median": "S1 invasive CAF"
  }
}
| sample_id | n_tumor | n_infiltrative | n_expanding | n_tumor_valid | infiltrative_proportion | mean_infil_dist_to_stromal | mean_expand_dist_to_stromal | |
|---|---|---|---|---|---|---|---|---|
| 0 | WTA_Preview_FFPE_Breast_Cancer_outs | 82303 | 9026 | 73277 | 82303 | 0.109668 | 33.619929 | 124.810325 |
| sample_id | n_cells | n_polarized | polarized_fraction | offset_norm_median | offset_distance_median_um | |
|---|---|---|---|---|---|---|
| 0 | WTA_Preview_FFPE_Breast_Cancer_outs | 168335 | 66658 | 0.395984 | 0.249179 | 1.083575 |
| gene | available | |
|---|---|---|
| 0 | EPCAM | True |
| 1 | KRT8 | True |
| 2 | KRT18 | True |
| 3 | KRT19 | True |
| 4 | KRT5 | True |
| 5 | KRT14 | True |
| 6 | ERBB2 | True |
| 7 | MKI67 | True |
| 8 | MMP11 | True |
| 9 | MUC1 | True |
| 10 | NIBAN1 | True |
| 11 | SORL1 | True |
Visual outputs#
axis_strength = pd.read_csv(STATIC_DIR / "axis_strength_by_radius.csv")
coupling = pd.read_csv(STATIC_DIR / "distance_expression_coupling.csv")

display(axis_strength[["radius_um", "ANE_density_median", "coh_median", "neigh_median"]].head(12))
display(coupling.sort_values("spearman_rho", ascending=False).head(12))
| radius_um | ANE_density_median | coh_median | neigh_median | |
|---|---|---|---|---|
| 0 | 5.0 | 0.012538 | 0.984708 | 0.0 |
| 1 | 10.0 | 0.003077 | 0.961127 | 0.0 |
| 2 | 20.0 | 0.000787 | 0.951273 | 0.0 |
| 3 | 30.0 | 0.000354 | 0.931270 | 1.0 |
| 4 | 50.0 | 0.000248 | 0.883856 | 2.0 |
| 5 | 75.0 | 0.000172 | 0.826181 | 4.0 |
| 6 | 100.0 | 0.000136 | 0.773440 | 6.0 |
| 7 | 150.0 | 0.000097 | 0.687385 | 11.0 |
| 8 | 200.0 | 0.000078 | 0.626449 | 17.0 |
| 9 | 300.0 | 0.000065 | 0.566703 | 34.0 |
| 10 | 400.0 | 0.000060 | 0.544598 | 60.0 |
| 11 | 500.0 | 0.000057 | 0.532520 | 90.0 |
| gene | n_cells | n_nonzero_cells | spearman_rho | p_value | mean_expression | tumor_enriched | |
|---|---|---|---|---|---|---|---|
| 10 | NIBAN1 | 82303 | 17686 | 0.288945 | 0.000000e+00 | 0.910902 | False |
| 9 | MUC1 | 82303 | 29462 | 0.153944 | 0.000000e+00 | 1.842898 | False |
| 11 | SORL1 | 82303 | 10690 | 0.123928 | 5.623827e-279 | 0.174684 | False |
| 3 | KRT19 | 82303 | 23458 | 0.107029 | 3.248345e-208 | 0.423581 | False |
| 2 | KRT18 | 82303 | 35448 | 0.029627 | 1.876570e-17 | 0.711396 | False |
| 6 | ERBB2 | 82303 | 6094 | 0.025378 | 3.299462e-13 | 0.085185 | False |
| 1 | KRT8 | 82303 | 19872 | -0.002597 | 4.562877e-01 | 0.314861 | False |
| 5 | KRT14 | 82303 | 608 | -0.003432 | 3.248030e-01 | 0.007825 | False |
| 8 | MMP11 | 82303 | 838 | -0.030752 | 1.103466e-18 | 0.011227 | False |
| 4 | KRT5 | 82303 | 6088 | -0.051441 | 2.380141e-49 | 0.098648 | False |
| 0 | EPCAM | 82303 | 67829 | -0.083403 | 5.935536e-127 | 3.102511 | False |
| 7 | MKI67 | 82303 | 11208 | -0.119694 | 2.994245e-260 | 0.330450 | False |
Biological interpretation#
In this S1/S5 mechanical context, about 11% of tumor cells are classified as infiltrative by the Delaunay-hop tumor-stroma rule. S1 CAF axis strength is summarized across radii from 5 to 500 microns, while the polarity summary keeps the continuous nucleus-to-cell offset and a thresholded polarized label. The coupling table is intentionally exploratory: it ranks how tumor-cell expression changes with nearest stromal distance and should be interpreted alongside the cell-group definitions and histology.
The CAF mechanical-state comparison is deliberately not named S5_CAF: this
Atera annotation has S5 DCIS tumor cells but no S5 CAF label. Instead, it
compares the available CAF/fibroblast pools and reports which pool has the
highest median ER, strongest local axial coherence, highest 100 um ANE density,
and strongest polarity offset in the executed notebook output.
HNSCC and Suzuki LUAD validation commands remain dataset-specific checks and are not run on this Atera tutorial dataset.
PDC rerun commands#
From the local repository:
python benchmarking/mechanostress_pdc/scripts/stage_to_pdc.py --dry-run
python benchmarking/mechanostress_pdc/scripts/stage_to_pdc.py
On PDC:
export PDC_ROOT=/cfs/klemming/scratch/h/hutaobo/pyxenium_mechanostress_atera_2026-04
export PDC_DATASET_ROOT=/cfs/klemming/projects/supr/naiss2025-22-606/data/WTA_Preview_FFPE_Breast_Cancer_outs
bash benchmarking/mechanostress_pdc/scripts/bootstrap_pdc_env.sh
bash benchmarking/mechanostress_pdc/scripts/submit_pdc_notebook.sh --dry-run
bash benchmarking/mechanostress_pdc/scripts/submit_pdc_notebook.sh
After the Slurm job completes, collect the executed notebook and compact static artifacts locally:
python benchmarking/mechanostress_pdc/scripts/collect_pdc_results.py